Local Area III Labor Market
Johnson, Leavenworth, & Wyandotte Counties
One of the services Workforce Partnership provides as a workforce development board is the collection and distribution of valuable labor market data for our local area (Johnson, Leavenworth, and Wyandotte Counties). Employers, job seekers and economic development professionals can utilize this data to help make informed hiring, employment and community development decisions.
Unemployment by local county
3%
JOCO
4.1%
WYCO
3.2%
LVW
Statewide unemployment
2.7%
Unemployment
66%
Labor Participation
41,807
Unemployed
Area III employment and average yearly wages
508,022
Regional
Employment
$67,927
Average Yearly
Wages
Average weekly wages by local county
$1317
JOCO
$1202
WYCO
$1102
LVW
Business Services Marketing & Outreach
cannonc@workforcepartnership.com
Last Updated as of: Q2/2023
Johnson County
Drivers of Employment Growth
Over the ten years ending 2022, employment in Total - All Industries for the Johnson County added 49,286 jobs. After adjusting for national growth during this period and industry mix share, the part of this employment change due to local competitiveness was a gain of 682 jobs—meaning this industry was more competitive than its national counterpart during this period.
+1.4%
Avg Annual % Change (Last 10 Years)
Regional Employment
388,575
+3.8%
Avg Annual % Change (Last 10 Years)
Avg Wages per Worker
$70,126
Top INdustries and Average annual wages


Industries
Employed
Avg Annual Wages
Health Care and Social Assistance
Professional, Scientific, and Technical Services
Retail Trade
Admin. & Support, Waste Management & Remediation Services
Accommodation and Food Services
Finance and Insurance
Transportation and Warehousing
Manufacturing
Educational Services
Wholesale Trade
Remaining Component Occupations
53,885
40,827
38,356
31,774
28,552
24,797
23,360
23,177
21,045
20,958
81,843
$63,718
$103,405
$40,848
$57,310
$26,506
$116,913
$57,028
$79,316
$45,103
$107,100
$76,716
education partners
26,721
All businesses in Johnson County
Wyandotte County
Drivers of Employment Growth
Over the ten years ending 2022, employment in Total - All Industries for Wyandotte County, Kansas added 6,612 jobs. After adjusting for national growth during this period and industry mix share, the part of this employment change due to local competitiveness was a loss of 7,795 jobs—meaning this industry was less competitive than its national counterpart during this period.
+0.9%
Avg Annual % Change (Last 10 Years)
Regional Employment
95,990
+3.6%
Avg Annual % Change (Last 10 Years)
Avg Wages per Worker
$62,476
Top INdustries and Average annual wages
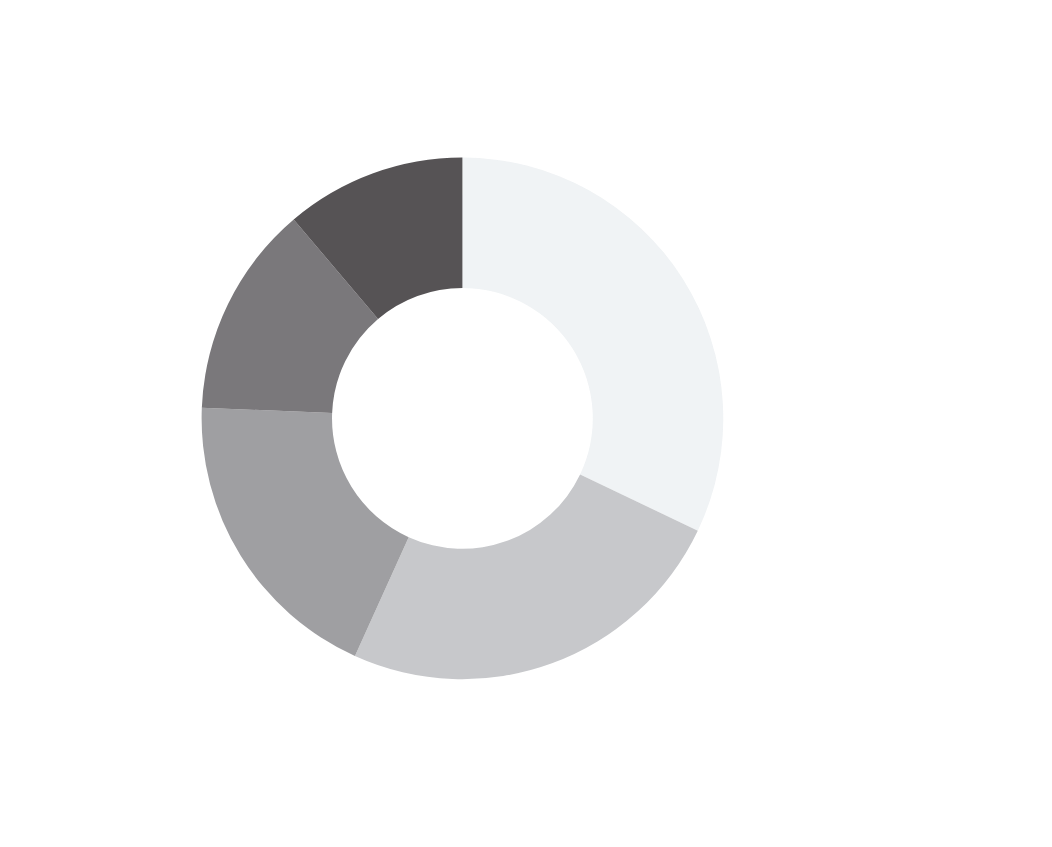

Industries
Employed
Avg Annual Wages
Health Care and Social Assistance
Transportation and Warehousing
Manufacturing
Retail Trade
Admin. & Support, Waste Management & Remediation Services
Educational Services
Accommodation and Food Services
Construction
Wholesale Trade
Public Administration
Remaining Component Occupations
18,291
14,062
10,770
7,494
6,783
6,383
6,383
5,691
5,160
3,218
11,755
$78,426
$55,599
$82,065
$39,319
$38,318
$55,244
$25,361
$69,586
$73,662
$81,289
$66,569
education partners
3615
All businesses in Wyandotte County
Leavenworth County
Drivers of Employment Growth
Over the ten years ending 2022, employment in Total - All Industries for the Leavenworth County shed 164 jobs. After adjusting for national growth during this period and industry mix share, the part of this employment change due to local competitiveness was a loss of 2,554 jobs—meaning this industry was less competitive than its national counterpart during this period.
+0.1%
Avg Annual % Change (Last 10 Years)
Regional Employment
23,457
+2.8%
Avg Annual % Change (Last 10 Years)
Avg Wages per Worker
$53,813
Top INdustries and Average annual wages
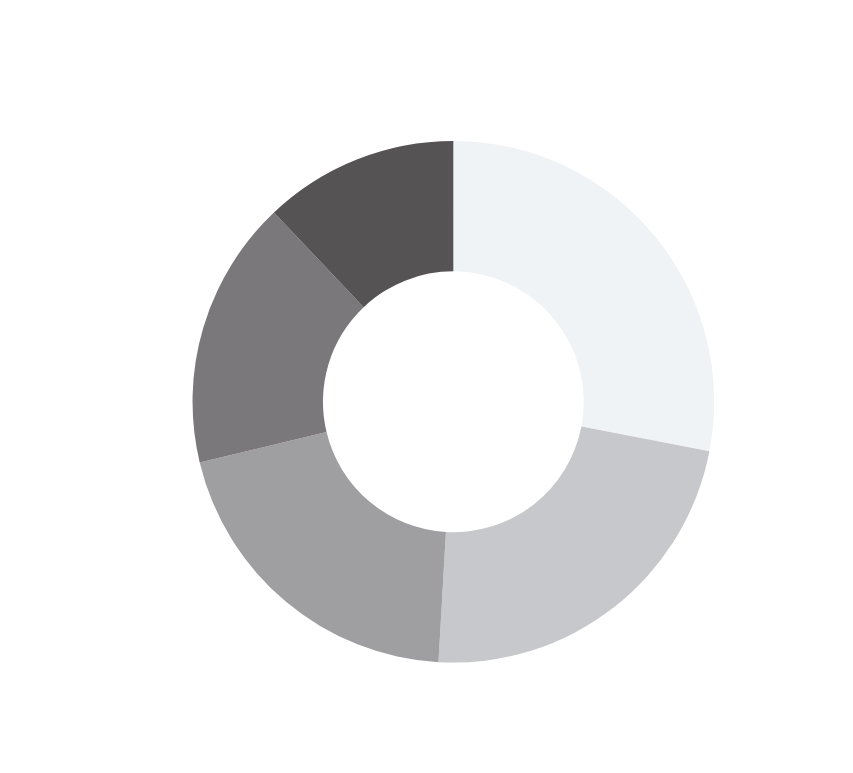

Industries
Employed
Avg Annual Wages
Public Administration
Health Care and Social Assistance
Educational Services
Retail Trade
Accommodation and Food Services
Construction
Professional, Scientific, and Technical Services
Manufacturing
Other Services (except Public Administration)
Admin. & Support, Waste Management & Remediation Services
Remaining Component Industries
3,852
3,142
2,796
2,289
1,659
1,607
1,526
1,193
1,090
1000
3,304
$78,222
$63,908
$40,689
$33,055
$20,428
$56,336
$80,185
$59,434
$39,196
$47,349
$54,891
Education partners
1,533
All businesses in Leavenworth County
Healthcare
Drivers of Employment Growth
Over the ten years ending 2022, employment in Health Care and Social Assistance for the Local Area 3 added 17,026 jobs. After adjusting for national growth during this period and industry mix share, the part of this employment change due to local competitiveness was a gain of 6,968 jobs—meaning this industry was more competitive than its national counterpart during this period.
+2.9%
Avg Annual % Change (Last 10 Years)
Regional Employment
75,318
+3.5%
Avg Annual % Change (Last 10 Years)
Avg Wages per Worker
$67,248


Employment and Average annual wages

Occupations
Employed
Avg Annual Wages
Registered Nurses
Personal Care Aides
Nursing Assistants
Medical Secretaries and Administrative Assistants
Home Health Aides
Medical Assistants
Childcare Workers
Licensed Practical and Licensed Vocational Nurses
Receptionists and Information Clerks
Physicians, All Other
Remaining Component Occupations
10,334
6,071
5,884
2,259
2,153
1,935
1,888
1,724
1,704
1,473
39,868
$81,100
$31,300
$38,300
$43,600
$31,300
$41,200
$30,600
$58,200
$36,700
$231,400
$76,500
Employment in Healthcare BY local County
County
Employed
Johnson County, KS
Wyandotte County, KS
Leavenworth County, KS
53,885
18,291
3,142
3,128
Health Care and Social Assistance businesses
Businesses
In 2022, there were 3,128 Health Care and Social Assistance establishments in the Local Area 3 (per covered employment establishment counts), an increase from 2,047 establishments ten years earlier in 2012.

occupations with One year or Less of education
Occupation
Avg Annual Salary (KS)
Avg Annual Job Openings (KS)
Certified Nursing Aide (CNA)
Emergency Medical Technician (EMT)
Medical Assistant
Dental Assistant
Licensed Practical Nurse (LPN)
Pharmacy Technician
Surgical Technologist
$27,080
$30,890
$31,450
$37,830
$44,260
$34,390
$44,610
2762
148
571
326
610
321
97
careers requiring associates degree
Occupation
Avg Annual Salary (KS)
Avg Annual Job Openings (KS)
Dental Hygienist
Medical Records and Health Information Technician
Paramedic
Physical Therapy Assistant
$68,340
$39,072
$30,890
$59,570
2762
148
571
326
requiring associates or Bachelors degree
Occupation
Avg Annual Salary (KS)
Avg Annual Job Openings (KS)
Radiologic Technologist and Technician
Respiratory Therapist
Registered Nurse
$54,750
$56,600
$62,450
130
104
1965
requiring Specialty or Bachelors degree Training
Occupation
Avg Annual Salary (KS)
Avg Annual Job Openings (KS)
Dietician and Nutritionist
Clinical Laboratory Technologist and Technician
Nuclear Machine Technologist
Radiation Therapist
$57,930
$48,350
$78,960
$72,140
47
242
9
15
requiring Masters degree
Occupation
Avg Annual Salary (KS)
Avg Annual Job Openings (KS)
Advanced Registered Nurse Practitioner
Physician Assistant
Speech Language Pathologist
Licensed Clinical Social Worker
$100,550
$107,610
$74,100
$55,470
189
92
107
173
requiring Doctorates degree
Occupation
Avg Annual Salary (KS)
Avg Annual Job Openings (KS)
Advanced Registered Nurse Practitioner
Physician Assistant
Speech Language Pathologist
Licensed Clinical Social Worker
$100,550
$107,610
$74,100
$55,470
189
92
107
173
approved Training Providers
Johnson County
Community College

Kansas City Kansas
Community College
Mid America College
of Health Sciences

Additional
Training Providers
Salary Comparison

Partners


Manufacturing
Drivers of Employment Growth
Over the ten years ending 2022, employment in Manufacturing for the Local Area 3 added 2,117 jobs. After adjusting for national growth during this period and industry mix share, the part of this employment change due to local competitiveness was a loss of 1,814 jobs—meaning this industry was less competitive than its national counterpart during this period.
+0.9%
Avg Annual % Change (Last 10 Years)
Regional Employment
35,140
+3.3%
Avg Annual % Change (Last 10 Years)
Avg Wages per Worker
$79,483


Employment and Average annual wages
Inspectors, Testers, Sorters, Samplers, and Weighers

Occupations
Employed
Avg. Ann. Wages
Annual Demand
Team Assemblers
2,906
$52,900
315
First-Line Supervisors of Production and Operating Workers
1,325
$74,100
138
Electrical, Electronic, and Electromechanical Equipment Assemblers, Except Coil Winders, Tapers, and Finishers
1,084
$42,700
130
Inspectors, Testers, Sorters, Samplers, and Weighers
1,026
$56,800
121
Packaging and Filling Machine Operators and Tenders
1,047
$44,200
127
Laborers and Freight, Stock, and Material Movers, Hand
779
$41,700
110
Printing Press Operators
805
$48,100
74
General and Operations Managers
682
$128,200
59
Shipping, Receiving, and Inventory Clerks
607
$42,700
59
Sales Representatives, Wholesale and Manufacturing, Except Technical and Scientific Products
796
$89,600
80
Remaining Component Occupations
24,057
$68,100
2,559
Total
35,114
businesses
In 2022, there were 887 Manufacturing establishments in the Local Area 3 (per covered employment establishment counts), an increase from 777 establishments ten years earlier in 2012.

Employment in Manufacturing BY local County
County
Employed
Johnson County, KS
Wyandotte County, KS
Leavenworth County, KS
26,230
22,996
14,058
2,067
Manufacturing businesses
local Education programs
Postsecondary Education Programs:
Aviation Institute of Maintenance-Kansas City
- Airframe Mechanics and Aircraft Maintenance Technology/Technician
Johnson County Community College
- Welding Technology/Welder
Kansas City Kansas Community College
- Welding Technology/Welder
Metropolitan Community College
- Industrial Production Technologies/Technicians, Other
- Welding Technology/Welder
Park University
- Business Administration and Management, General
Pinnacle Career Institute
- Electromechanical/Electromechanical Engineering Technology/Technician
- Telecommunications Technology/Technician
University of Missouri-Kansas City
- Chemistry, General
- Mechanical Engineering



Salary Comparison

- In 2022, Manufacturing produced $6.7 billion in GDP for the Local Area 3.
- As of 2023Q2, Manufacturing in the Local Area 3 are estimated to make $13.8 billion in annual purchases from suppliers in the United States with about 23% or $3.2 billion of these purchases being made from businesses located in the Local Area 3.
Construction

Drivers of Employment Growth
Over the ten years ending 2022, employment in Construction for the Local Area 3 added 7,518 jobs. After adjusting for national growth during this period and industry mix share, the part of this employment change due to local competitiveness was a gain of 1,430 jobs—meaning this industry was more competitive than its national counterpart during this period.
+3.5%
Avg Annual % Change (Last 10 Years)
Regional Employment
26,737
+3.6%
Avg Annual % Change (Last 10 Years)
Avg Wages per Worker
$73,287


Employment and Average annual wages

Occupations
Employed
Avg Annual Wages
Construction Laborers
Carpenters
1st Line Supervisors: Construction & Extraction Workers
Electricians
Plumbers, Pipefitters, and Steamfitters
Heating, A/C , and Refrigeration Mechanics / Installers
Operating Engineers & Other Equipment Operators
Construction Managers
Painters, Construction, & Maintenance
Cement Masons and Concrete Finishers
Remaining Component Occupations
3,190
2,263
1,857
1,640
1,486
1,219
1,015
1,090
912
828
11,208
$51,700
$65,600
$83,300
$72,000
$71,900
$69,000
$70,900
$105,700
$59,300
$61,800
$66,100
Employment in construction BY local County
County
Employed
Johnson County, KS
Wyandotte County, KS
Leavenworth County, KS
23,360
14,062
720

2,194
Construction Businesses
Businesses
In 2022, there were 2,194 Construction establishments in the Local Area 3 (per covered employment establishment counts), an increase from 1,892 establishments ten years earlier in 2012.

local Education programs
Postsecondary Education Programs:
Johnson County Community College
- Electrician
- Heating, AC, Ventilation, & Refrigeration Maintenance Tech
Kansas City Kansas Community College
- Carpentry/Carpenter
- Electrician
- Heating, AC, Ventilation, & Refrigeration Maintenance Tech
- Welding Technology / Welder
Metropolitan Community College
- Heating, AC, Ventilation, & Refrigeration Maintenance Tech
- Welding Technology / Welder
Park University
- Business Administration and Management, General
Pinnacle Career Institute
- Electromechanical Engineering Tech


Salary Comparison

- In 2022, Construction produced $3.0 billion in GDP for Local Area 3.
- As of 2023Q2, Construction in Local Area 3 are estimated to make $3.0 billion in annual purchases from suppliers in the United States with about 41% or $1.2 billion of these purchases being made from businesses located in the Local Area 3.
Youthbuild
YouthBuild KCK assists out-of-school youth ages 16-24 in obtaining their high-school credential and training them for a job in the construction or healthcare industry. The program is an intensive, full-time program, providing instruction and leadership development five days a week. Trainees spend 40% of their time in GED instruction, 50% of their time in construction or healthcare training (both classroom and in the field) and the remaining 10% of their time in leadership and character development work. The program aims to serve approximately 35 young people each year – small cohorts, but deep engagement. Trainees are also engaged in mentorship with volunteer adults, as well as service learning opportunities through the Americorps program.
93% of YouthBuild KCK's cash needs are funded through a U.S. Department of labor grant, with the balance funded through YouthBuild USA and private donations.
- Visit https://workforcepartnership.com/youthbuild-kck/ for more info
Transportation & Warehousing
Drivers of Employment Growth
Over the ten years ending 2022, employment in Transportation and Warehousing for Local Area 3 added 16,487 jobs. After adjusting for national growth during this period and industry mix share, the part of this employment change due to local competitiveness was a gain of 5,092 jobs—meaning this industry was more competitive than its national counterpart during this period.
+5.8%
Avg Annual % Change (Last 10 Years)
Regional Employment
38,142
+2.3%
Avg Annual % Change (Last 10 Years)
Avg Wages per Worker
$56,540


Employment and Average annual wages
Occupations
Employed
Avg Annual Wages
Annual Demand
Heavy Truck and Tractor Trailer Drivers
Laborers and Freight, Stock, Material Movers
Stockers and Order Fillers
Light Truck Drivers
Industrial Truck and Tractor Operators
Supervisors: Transport & Material Movers
School Bus Drivers
Shipping, Recieving, and Inventory Clerks
Postal Service Mail Carriers
Packers and Packagers, Hand
Remaining Component Occupations
6,451
5,340
3,363
3,240
2,482
1,222
1,088
1,001
797
666
12,467
$59,200
$43,100
$41,300
$55,800
$49,700
$67,300
$47,200
$44,000
$62,100
$42,100
$66,600
809
859
607
478
303
168
175
113
54
105
1,474
Total
38,115
Employment BY local County
County
Employed
61,586
50,324
17,676
Johnson County, KS
Wyandotte County, KS
Leavenworth County, KS

805
Transportation and Warehousing businesses
BUSINESSES
In 2022, there were 805 Transportation and Warehousing establishments in the Local Area 3 (per covered employment establishment counts), an increase from 620 establishments ten years earlier in 2012.

approved Training Providers
Salary Comparison

- In 2022, Transportation and Warehousing produced $3.8 billion in GDP for the Local Area 3.
- As of 2023Q2, Transportation and Warehousing in the Local Area 3 are estimated to make $3.4 billion in annual purchases from suppliers in the United States with about 46% or $1.6 billion of these purchases being made from businesses located in Local Area 3.
Finance & Insurance
Drivers of Employment Growth
Over the ten years ending 2021, employment in Finance and Insurance for the Kansas City, MO-KS MSA added 955 jobs. After adjusting for national growth during this period and industry mix share, the part of this employment change due to local competitiveness was a loss of 7,150 jobs—meaning this industry was less competitive than its national counterpart during this period.
-0.6%
Avg Annual % Change (Last 10 Years)
Regional Employment
26,400
+3.7%
Avg Annual % Change (Last 10 Years)
Avg Wages per Worker
$113,752


Employment and Average annual wages

Occupations
Employed
Avg Annual Wages
Annual Demand
Insurance Sales Agents
Customer Service Reps
Tellers
Personal Financial Advisors
Loan Officers
Securities, Commodities & Financial Sales Agents
Loan Interviewers and Clerks
Claims Adjusters, Examiners, and Investigators
General and Operations Managers
Secretaries and Administrative Assistants
Remaining Component Occupations
2,662
2,402
1,785
1,777
1,386
1,232
1,039
967
790
757
11,577
$93,100
$45,600
$37,300
$120,800
$92,300
$96,300
$52,200
$80,100
$131,000
$43,200
$76,700
279
336
167
158
116
119
98
78
79
84
1,148
Total
26,375
Employment BY local County
County
Employed
Johnson County, KS
Wyandotte County, KS
Leavenworth County, KS
24,797
929
673

2,434
Finance & Insurance businesses
Establishments
In 2022, there were 2,434 Finance and Insurance establishments in the Local Area 3 (per covered employment establishment counts), an increase from 2,026 establishments ten years earlier in 2012.

local Education programs
Postsecondary Education Programs:
MidAmerica Nazarene University
- Registered Nursing/Registered Nurse
Park University
- Business Administration & Management (General)
- HR Management / Personnel Administration
Research College of Nursing
- Registered Nursing/Registered Nurse
Rockhurst University
- Management Science
- Registered Nursing/Registered Nurse
University of Missouri-Kansas City
- Accounting
- Computer Science
- Finance, General
- Registered Nursing/Registered Nurse


Salary Comparison

- As of 2023Q2, Finance and Insurance in Local Area 3 are estimated to make $6.4 billion in annual purchases from suppliers in the United States with about 63% or $4.0 billion of these purchases being made from businesses located in Local Area 3.
- In 2022, Finance and Insurance produced $6.2 billion in GDP for Local Area 3.
Computer Systems Design
Drivers of Employment Growth
Over the ten years ending 2022, employment in Computer Systems Design and Related Services for the Kansas City, MO-KS MSA added 7,804 jobs. After adjusting for national growth during this period and industry mix share, the part of this employment change due to local competitiveness was a loss of 1,538 jobs—meaning this industry was less competitive than its national counterpart during this period.
+3.7%
Avg Annual % Change (Last 10 Years)
Regional Employment
11,482

+3.0%
Avg Annual % Change (Last 10 Years)
Avg Wages per Worker
$116,323

Employment and Average annual wages
Occupations
Employed
Avg. Ann. Wages
Annual Demand
Software Developers
2,581
$112,100
259
Computer User Support Sepcialists
937
$61,600
94
Computer Systems Analysts
731
$98,900
68
Sales Representatives of Services Except Adverstising, Insurance, Financial Service, & Travel
634
$115,000
80
Computer & Information Systems Managers
498
$156,000
49
Computer Netowrk Architects
381
$111,600
30
General and Operations Managers
363
$144,000
38
Network & Computer System Admins
323
$91,800
27
Customer Service Reps
282
$50,400
41
Software QA Analysts and Testers
273
$88,100
28
Remaining Component Occupations
4,454
$86,600
476
Total
11,486
Employment BY local County
County
Employed
10,156
731
595
Johnson County, KS
Wyandotte County, KS
Leavenworth County, KS

2,157
Computer System Design Businesses
businesses
In 2022, there were 2,157 Computer Systems Design and Related Services establishments in the Local Area 3 (per covered employment establishment counts), an increase from 1,185 establishments ten years earlier in 2012.

approved Training Providers
Centriq Training
Salary Comparison

KC Tech Council
Last Updated as of: Q2/2023
Johnson County Workforce Center
8535 Bluejacket Street
Lenexa, KS, 66214
(913) 577-5900 FDJO@workforcepartnership.com
Leavenworth County Workforce Center
515 Limit Street, Ste. 200
Leavenworth, KS, 66048
(913) 651-1800
FDLV@workforcepartnership.com
Wyandotte County Workforce Center
626 Minnesota Avenue
Wyandotte, KS, 66101
(913) 279-2600
FDWY@workforcepartnership.com


